

Abstract: Compared to single fixed speed-ratio reduction gear, two-speed AMT can reducerequirements for battery and motor performance of the complete vehicle system, but reasonable shiftstrategy is required to ensure that requirements of vehicle economy and power can be met. Firstly, this paper analyzes changes of battery , motor and transmission efficiency under the driving conditionwith changes of vehicle speed and accelerator pedal opening. To realize the goal of maximum systemefficiency, the paper designs an optimal economic shift strategy. Secondly, the paper analyzeschanges of the accelerated speed under different shifts with changes of vehicle speed and acceleratorpedal opening. To realize the goal of maximum system efficiency, the paper designs an optimaldynamic shift strategy. Finally , the paper designs a shift strategy switch controller, makes up powerconsumption of 100 kilometers and acceleration time into comprehensive performance index, calculates power demand factors based on the fuzzy theory, and selects corresponding shift strategy based onpower demand factors. The simulation and experiment results show that compared with the traditionalshift strategy, the average power consumption of 100 kilometers is reduced by 9. 97%, and theacceleration is slightly worse by about 3. 96% . Therefore , the shift strategy can not only ensure thedriver's power demand, but also improve the economy and extend vehicle endurance mileage.Key words: two-speed AMT;system efficiency; fuzzy control; dynamic demand factor;switching controller.
In order to reduce the performance requirements of the battery and drive motor for pure electric vehicles, they are generally matched with multi-gear automatic transmissions, of which two-speed AMT is a hot research topic with the advantages of simple structure, low cost and high transmission efficiency.
In order to balance the economy and power of the vehicle, and to ensure that the drive motor always works efficiently, a reasonable shift strategy for the two-gear AMT needs to be designed. Around this problem, experts and scholars at home and abroad have conducted a lot of research. Xiao Lijun et al. proposed an integrated and coordinated control method including the drive motor, using PID and finite state switching control strategy to regulate the motor speed, and the simulation and bench test results show that the drive motor participates in the gear shift, and the gear shift process is faster. Liu Fuxiao et al.2 developed a power and economy shifting strategy with the objectives of shortest acceleration time and highest drive motor efficiency, respectively, and designed a switching controller based on fuzzy theory. simulation results showed that the method can ensure the economy and power of the vehicle. fu Jiangtao et al. established an optimal energy consumption model and introduced two additional cost functions to prevent frequent shifting. Simulation and test results show that the strategy effectively reduces the vehicle energy consumption over 100 km. Li Congbo et al. proposed an economic mode shift strategy with low energy loss, and developed a drive motor torque calculation method. At present, the development of common shift strategy only analyzes the characteristics of the drive Shen machine and its efficiency changes, or calculates the minimum output torque of the current drive motor with the goal of minimum energy consumption, which improves the vehicle economy to a certain extent, but will greatly sacrifice the vehicle dynamics5-. The efficiency of the power battery and the efficiency of the transmission in the pure electric vehicle power system are also key factors affecting the range of the vehicle. At the same time, the current widely used shift strategy is an off-line gear selection method, which cannot be dynamically adjusted for different driving conditions. In this paper, the efficiency model of the drive motor, battery and transmission is built to analyze the changes of the system efficiency under each driving condition, and the best economic shift strategy is formulated with the goal of the highest system efficiency. In order to ensure the dynamics of the vehicle, the best dynamics shift strategy is developed with the goal of maximum acceleration. Finally, a power demand factor calculation method is designed based on the fuzzy theory to determine which shift strategy should be used for the vehicle at this time by the power demand factor. The simulation and test results show that the designed shifting strategy can ensure that the vehicle can meet the driver's power demand and also increase the range of pure electric vehicles.
1 Transmission System Structure
This study is based on a pure electric vehicle equipped with a two-speed AMT. The transmission system of this vehicle consists of a power battery, a permanent magnet synchronous motor, a two-gear AMT and a differential, as shown in Figure 1. The powertrain integrated controller is responsible for transmitting control signals to the battery, motor and two-gear AMT, while the electric energy is transferred between the battery and the permanent magnet synchronous motor, and the mechanical energy is transferred between the motor, two-gear AMT and differential.

Since the drive motor has a fast response, the two-gear AMT adopts a clutchless structure, as shown in Figure 2.
2 Shift strategy design
2.1 Transmission system efficiency analysis
When formulating an economic shift strategy, the efficiency changes of the powertrain components need to be fully considered. Since the efficiency of other components is high and does not change significantly under each driving condition, only the efficiency changes of drive motor, power battery and transmission are analyzed in this paper.

1) Drive motor efficiency model to establish the permanent magnet synchronous motor model mainly has 2 methods, theoretical analysis and experimental modeling. Theoretical analysis modeling is to establish the differential equations describing the motor characteristics by analyzing the force and electrical principle of each part of the permanent magnet synchronous motor. However, because of the complex electromagnetic coupling relationship inside the motor and some parameters are difficult to measure, the experimental modeling method is used to analyze the efficiency change of the drive motor by collecting the speed, power, torque and other data of the motor under different g-subject loads, establishing a data table that can describe the actual dynamic characteristics of the motor, and using table look-up and interpolation to obtain the efficiency of the motor under different working conditions.
Figure 3 shows the surface of motor efficiency Nm with motor speed Wm and torque Tm

To facilitate the analysis of the motor efficiency, Figure 3 is projected onto the motor torque-speed plane to obtain the contour plot of motor efficiency shown in Figure 4. It can be seen from Fig. 4 that the motor efficiency is low when the motor speed is below 2000r/min and the output torque is below 150N-m. Therefore, when designing the shifting strategy, the drive motor should be avoided to work in this interval.

2) Power battery efficiency model
Iron phosphate carp battery is a widely used vehicle power battery, and its operating performance is affected by temperature, terminal voltage, single cell SOC and other factors. As the working process of the battery is a complex chemical reaction process, it is also difficult to establish an accurate mathematical model through theoretical analysis. Therefore, in this paper, the efficiency model of the battery is established by combining experiments with numerical fitting.
Since this study only involves the upshift strategy of pure electric vehicles, only the power battery discharge efficiency model is established here. The specific method is as follows: CKHF-500V500A intelligent discharger is used for the test, and the test temperature is set in the range of (35 2)C with reference to the working temperature of the battery during the normal driving of the pure electric vehicle. During the driving of the vehicle, the powertrain integrated controller will interpret the driver's driving intention, calculate the torque to be output by the motor, and send a power request to the battery management system. The battery efficiency and SOC data are collected at different discharge powers and fitted to obtain the battery efficiency graph shown in Figure 5.

3) Transmission efficiency model The power loss of the transmission is mainly composed of gear meshing power loss, bearing friction power loss and oil churning power loss. According to the specific structure of a two-speed AMT selected in this paper, the calculation formula of each power loss is as follows.

Where: Pc for gear meshing power loss; Ph for gear sliding friction power loss; Pr for gear rolling friction power loss; f(s) for instantaneous friction factor; Fn for tooth surface normal load; Vh(s) for meshing out loss sliding speed; h for elastic power oil film thickness; Vg for average rolling speed; b for gear effective tooth width; β for gear indexing circle helix angle.

Where:P is the bearing friction loss power;M is the SKF model bearing friction torque;n is the bearing rotation speed

Where: Pj is the churning loss power; Tchurn is the churning torque
2.2 The optimal economic shifting strategy with optimal system efficiency According to the driving equation of the vehicle, the output power of the vehicle under driving conditions can be obtained, as shown in equation (4).

And the input power can be expressed as

Combining with equation (4)(5), the efficiency of the whole vehicle system can be obtained as

Where: ηsys is the total system efficiency; μ is the road adhesion coefficient; m is the vehicle mass; α is the ramp angle; Cd is the air resistance coefficient; A is the windward area; δ is the mass conversion factor; v is the vehicle speed; ηm and ηb are the motor and battery efficiency respectively; Tm is the motor output torque; Wm is the motor angular speed.
Without considering the ramp resistance, it can be obtained from equation (6) that the system efficiency is related to the vehicle speed, acceleration, battery efficiency, motor efficiency and other factors. In order to ensure the highest efficiency of the vehicle system during the driving process, the controller needs to control the vehicle at different accelerator pedal opening and speed to select a reasonable gear to ensure the highest efficiency of the whole vehicle system. Based on the vehicle model in AVL Cruise and the calculation method given above, the system efficiency of 1st and 2nd gears with the battery SOC of 0.9 is calculated respectively, as shown in Figure 6&7.

Combining Figs. 6 and 7 gives Fig. 8, from which it can be seen that the system is always most efficient before and after shifting, as long as the shifting is done at the intersection of the two surfaces.

Since the vehicle economy is best when the system is most efficient, the best economy upshift curve can be obtained by projecting the intersection of the surfaces in Figure 8 into the acceleration pedal opening-vehicle speed plane, as shown in Figure 9.

By analyzing the best economy upshift curve under different SOC, we can get the best economy shift surface of pure electric vehicle under different SOC, as shown in Figure 10.

From Figure 10, we can see that the optimal economic upshift curve changes significantly when the battery SOC is below 0.4. The reason is that the battery efficiency decreases dramatically when the battery SOC is too low. 2.3 Optimal power shift strategy
Without considering the ramp resistance, equation (4) shows that the higher the acceleration of the vehicle, the higher the driving power. Analyzing the relationship between vehicle acceleration with accelerator pedal opening and vehicle speed in different gears, we can get the acceleration change in each gear as shown in Figure 11

In order to obtain sufficient dynamics, it is necessary to ensure the maximum acceleration before and after shifting, as can be seen from Figure 11: shifting at the intersection of gear and 2nd gear acceleration surfaces can ensure the maximum acceleration before and after shifting. Based on the above principle, the best power upshift curve can be obtained, as shown in Figure 12

Similarly, the change of the optimal power upshift curve with different SOC is analyzed as shown in Figure 13. From Fig. 13, it can be seen that the change of the optimal power upshift curve is not obvious with the change of SOC.

3 Shift strategy switching controller design
The best economy and power shift strategies were designed above, but in the actual driving process, power and economy are a pair of conflicting indicators. When the driver pursues the power, if the driver adopts the unreasonable economy shift strategy, it will lead to the reduction of power output at the shift point, which will cause the shift stutter and affect the ride comfort, and vice versa. Therefore, in order to avoid this problem, it is necessary to identify the driver's driving intention and switch a reasonable gearshift strategy.
3.1 Driving Intent Recognition
The driver model calculates the acceleration or brake pedal opening based on the difference between the current driving state and the desired state of the vehicle, so the driver's driving intentions can be inferred from the accelerator pedal opening and its change rate combined with the current vehicle speed.
In order to quantify the driver's driving intention, the comprehensive performance index E and the power demand factor are proposed, and the specific calculation method is as follows:
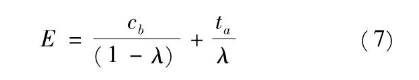
Where: Cb is the average power consumption of 100 km after normalization of the scale; ta is the acceleration time to reach the desired speed after normalization of the scale.
The larger the power demand factor, the more power the driver needs, and the best power shift strategy should be chosen to obtain a shorter acceleration time. If the power demand factor is smaller, it means the driver pursues more economy, so the best economy shift strategy should be chosen to get smaller average 100km electricity consumption. By analyzing the accelerator pedal opening and its change rate, the reasonable power demand factor is inferred, and the corresponding shift strategy is selected so that the comprehensive performance index is minimized, which means the best shift strategy is selected.
3.2 Determination of power demand factor based on fuzzy theory
The determination of the power factor involves many factors and complex nonlinear relationships, and it is difficult to establish an accurate mathematical model. Fuzzy control theory does not rely on accurate data models and is robust enough to accurately derive a reasonable power demand factor based on the input. In this paper, the accelerator pedal opening and its change rate are selected as the input of the fuzzy controller, and the power demand factor increment is selected as the output of the fuzzy controller, and the structure of the system is shown in Figure 14.
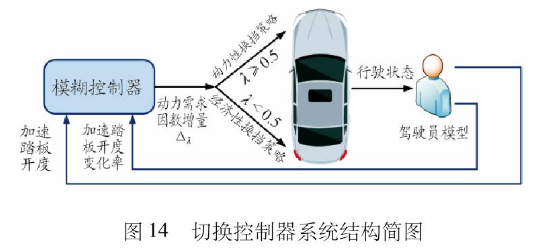
As can be seen from Figure 14: When the power demand factor is optimized by the fuzzy controller to be less than 0.5, the switching controller considers that the current driving intention is to obtain better economy, and vice versa, the driver needs more power output. The above switching logic can ensure the best overall performance during the driving process.
As the vehicle is in braking condition, it needs to recover as much energy as possible and choose the economical downshift strategy. Therefore, in this study, we only design the switchover controller for pure electric vehicles under driving conditions.
The relationship between the driver's intention and the accelerator pedal opening and its rate of change is analyzed as follows: when the driver has a stronger power demand, he will press the accelerator pedal, and the larger the accelerator pedal opening, the stronger the driver's power demand at this time, and vice versa. At the same time, the rate of change of the accelerator pedal opening can reflect the urgency of the driver's power needs, the greater the rate of change indicates that the driver urgently needs more power output, and vice versa
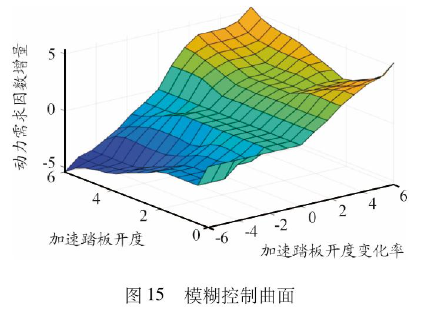
Combining with the above rules, the fuzzy domain of accelerator pedal opening is 0,6], the fuzzy domain of accelerator pedal opening rate is [-6,6], and the fuzzy domain of power demand factor increment is [-6,6], a reasonable subordinate degree function and fuzzy control rule table are formulated to obtain the fuzzy control surface shown in Figure 15.
The incremental power demand factor output from the fuzzy controller is added with the current power demand factor to determine which gearshift strategy to use. When the power demand factor λ≥0.5, the driver needs more power for the vehicle and the best power shift strategy is used, while when λ<0.5, the best economy shift strategy is used.
4 Simulation and test
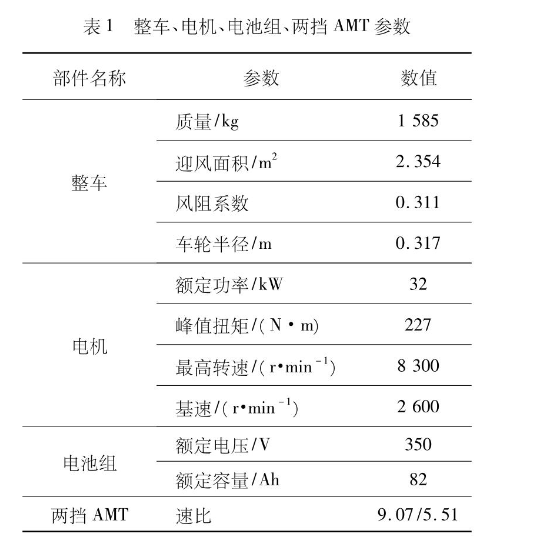
In order to verify the effectiveness of the designed shifting strategy, the control strategy is compared with the conventional shifting strategy based only on the optimal motor efficiency. The simulation parameters are shown in Table 1, the initial SOC value of the battery is set to 0.9, and the NEDC city cycle condition is selected for the simulation.
The simulation results are shown in Figures 16 to 19.
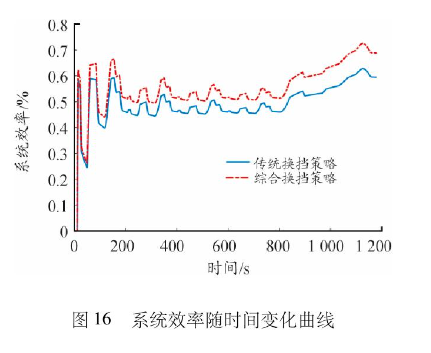
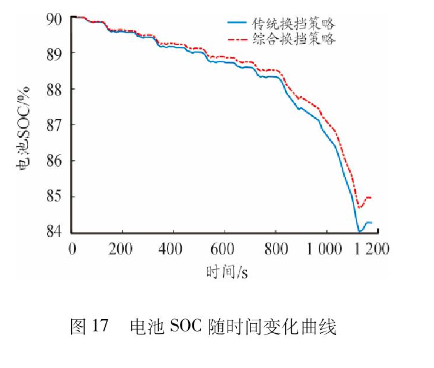
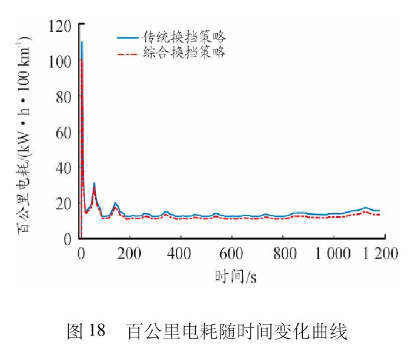
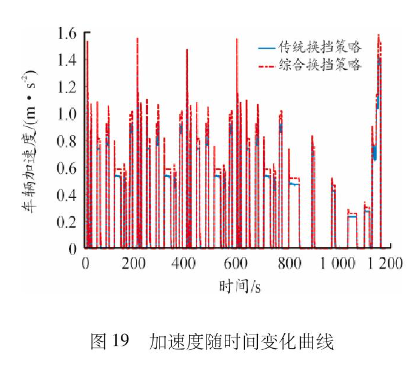
From the simulation results in Table 2, it can be seen that: compared with the traditional shift strategy, the integrated shift strategy designed in this paper can effectively improve the efficiency of the system, with an average efficiency improvement of 11.19%, battery SOC improvement of about 10.37%, average 100 km electric power consumption reduction of 9.97%, and average acceleration deterioration of about 3.96%. This shows that the integrated shift strategy can effectively improve the economy of pure electric vehicles and extend the range, while ensuring the vehicle dynamics to meet the driver's driving needs.
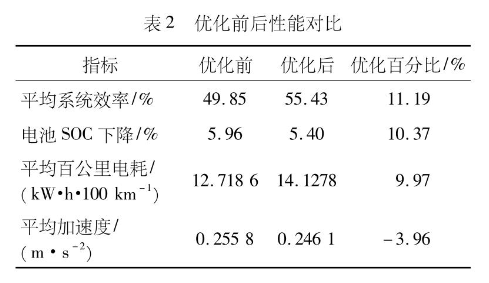
In order to verify the effectiveness and application of the shift strategy, a two-gear AMT test rig as shown in Figure 20 was used. The test results are shown in Figures 21 and 22
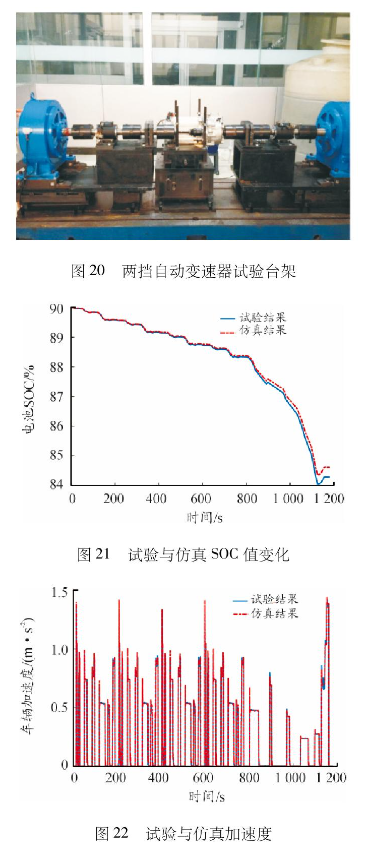
From Figs. 21 and 22, it can be seen that although there are some differences between the test data and the simulation data, the trends are more or less the same, and it can be proved that the designed shift strategy is equally effective for the real two-gear AMT.
5 Conclusion
1) The efficiency models of pure electric vehicle power battery, drive motor and transmission were analyzed, and the efficiency trends of the main components of pure electric vehicle and their influencing factors were obtained.
2) By analyzing the variation of system efficiency with accelerator pedal opening and vehicle speed in different gears when SOC is 0.9, the optimal economic shift curve is obtained with the highest system efficiency as the target projection, and then by analyzing the variation of the optimal economic shift curve in different SOC, the optimal economic shift strategy is formulated for each working condition of the vehicle.
3) By analyzing the variation of acceleration with accelerator pedal opening and vehicle speed in different gears, the optimal power shift curve was designed with the goal of maximum acceleration. Similarly, the influence of SOC variation on the optimal dynamics shift curve was analyzed.
4) A power demand factor adjustment controller was designed based on fuzzy theory to predict the power demand of the vehicle by driving behavior and to switch between economic and dynamic shift strategies by combining 100km power consumption and acceleration time as comprehensive performance indexes and taking the accelerator pedal opening and its change rate as input. Through simulation and experiment, it is found that the designed pure electric vehicle shift strategy can greatly improve the economy and extend the range of the vehicle compared with the traditional shift strategy while ensuring the power.